Showing posts with label state map. Show all posts

Thursday, January 14, 2010

2010 Senate Elections Overview


2010 Senate Elections Overview


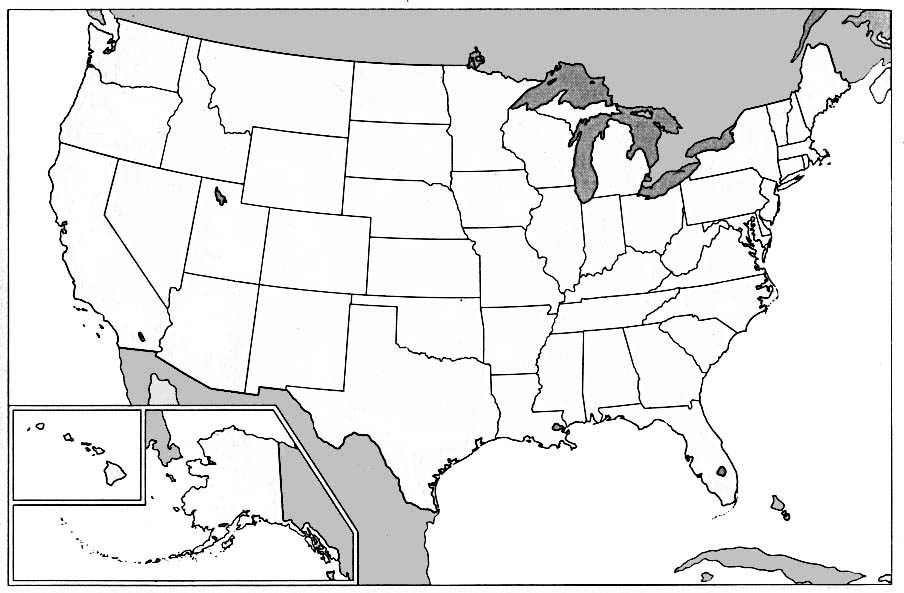
The following map is of the U.S. Senate seats up for election in 2010. States colored blue have a Democratic seat up for election. States colored red have a Republican seat up for election. States colored purple have both a Democratic and Republican seat up for election. There is a listing of the seats up for election in 2010. Next to each state, there is the name of the current senator and the percentage they recieved in their last election Open seats are noted as such.


Democratic Seats (17)


1. Indiana - Bayh, 62%

2. Colorado - Bennet, Appointed

3. California - Boxer, 58%

4. Illinois - Burris, Appointed, Open Seat

5. Connecticut - Dodd, 66%, Open Seat

6. North Dakota - Dorgan, 68%, Open Seat

7. Wisconsin - Feingold, 55%

8. Hawaii - Inouye, 73%

9. Vermont - Leahy, 71%

10. Arkansas - Lincoln, 56%

11. Maryland - Mikulski, 65%

12. Washington - Murray, 55%

13. Nevada - Reid, 61%

14. New York - Schumer, 71%

15. Pennsylvania - Specter, 53% [Elected as a Republican]

16. New York - Gillibrand, Appointed

17. Oregon - Wyden, 64%


Republican Seats (18)


1. Utah - Bennett, 68%

2. Missouri - Bond, 56%, Open Seat

3. Kansas - Brownback, 69%, Open Seat

4. Kentucky - Bunning, 51%, Open Seat

5. North Carolina - Burr, 52%

6. Oklahoma - Coburn, 53%

7. Idaho - Crapo, Uncontested

8. South Carolina - DeMint, 54%

9. Iowa - Grassley, 70%

10. New Hampshire - Gregg, 66%, Open Seat

11. Georgia - Isakson, 58%

12. Florida - LeMieux, Appointed, Open Seat

13. Arizona - McCain, 77%

14. Alaska - Murkowski, 49%

15. Alabama - Shelby, 68%

16. South Dakota - Thune, 51%

17. Louisiana - Vitter, 51%

18. Ohio - Voinovich, 64%, Open Seat


Analysis

The 2010 midterm elections will be the first barometer of how the American people feel since Obama's election in 2008. That being said, Obama himself is not so much to credit or blame for whatever the results may be in 2010 because for the most part these races will be decided based on the concerns of that state. In order for Democrats to hold onto their 59 seat majority in the Senate, they need to either keep all of their seats within the Democratic party or pick up at least as many Republican seats as they lose.


The best opportunities for Democrats are (in no particular order): Missouri, Kentucky, New Hampshire, Louisiana, and Ohio. Of these, the races the Democrats should focus their energy on are New Hampshire and Ohio. Kentucky is included because of the fact that it is an open seat and Democrats are likely to nominate a moderate candidate, and Louisiana is included because Democrats are likely to put forth a popular moderate candidate. The best opportunities for Republicans are (in no particular order): North Dakota, Arkansas, Nevada, and Colorado. Of these, the races Republicans should focus their energy on are North Dakota and Arkansas. Republicans are almost certain to win North Dakota because they are expected to pick the current popular governor to run, and Democrats have no prominent candidates up to this point.

Sunday, August 23, 2009

2008 Presidential Election - Exit Poll Map - Rural Voters


The following map shows how rural voters in each state voted. Obama won rural voters in states colored blue. McCain won rural voters in states colored red. There was not a statistically significant number of rural voters in states colored grey.

Obama won rural voters in 16 states, including 2 states that he didnt even win overall (South Dakota, South Carolina). McCain won rural voters in 27 states, including 8 states that he didnt even win overall (Nevada, Michigan, Indiana, Ohio, Pennsylvania, Virginia, North Carolina, Florida). There was not statistically significant data for 7 states (California, Utah, Maryland, New Jersey, Delaware, Rhode Island, Massachusetts).

This exit poll data is from CNN.

Saturday, August 22, 2009

2008 Presidential Election - Exit Poll Map - Young Voters (18-29 years old)


The following map shows how young voters in each state voted. Obama won young voters in states colored blue. McCain won young voters in states colored red.

Obama won young voters in 42 states, including 14 states that he didnt even win overall (Arizona, Montana, North Dakota, South Dakota, Nebraska, Kansas, Texas, Arkansas, Missouri, Mississippi, Alabama, Tennessee, Kentucky, South Carolina). McCain won young voters in 8 states, all of which he won overall.

This exit poll data is from CNN.

2008 Presidential Election - Exit Poll Map - Suburban Voters


The following map shows how suburban voters in each state voted. Obama won suburban voters in states colored blue. McCain won suburban voters in states colored red. There was not a statistically significant number of suburban voters in states colored grey.

Obama won suburban voters in 27 states, all of which he won overall. McCain won suburban voters in 23 states, including 3 states he didnt even win overall (Minnesota, Indiana, North Carolina). There was not statistically significant data for 2 states (Montana, Wyoming).

This exit poll data is from CNN.

2008 Presidential Election - Exit Poll Map - Independent Voters


The following map shows how independent voters in each state voted. Obama won independent voters in states colored blue. McCain won independent voters in states colored red.

Obama won independent voters in 30 states, including 3 states that he didnt even win overall (Arizona, Nebraska, Kansas). McCain won independent voters in 20 states, all of which he won overall.

This exit poll data is from CNN.

2008 Presidential Election - Exit Poll Map - Male Voters


The following map shows how male voters in each state voted. Obama won male voters in states colored blue. McCain won male voters in states colored red.

Obama won male voters in 25 states, all of which he won overall. McCain won male voters in 25 states, including 3 states that he didnt even win overall (Colorado, Indiana, North Carolina).

This exit poll data is from CNN.

2008 Presidential Election - Exit Poll Map - Female Voters


The following map shows how female voters in each state voted. Obama won female voters in states colored blue. McCain won female voters in states colored red.

Obama won female voters in 31 states, including 3 states that he didnt even win overall (Montana, Missouri, Georgia). McCain won female voters in 19 states, all of which he won overall.

This exit poll data is from CNN.

Saturday, July 25, 2009

Current US House Map (by State Delegation)


The following map shows the current party breakdown of the United States House of Representatives from each state. States colored red have more Republican representatives in the House than Democratic representatives. States colored blue have more Democratic representatives in the House than Republican representatives. The current breakdown of state delegations is that there are 16 states have a Republican majority in their delegation, 33 states have a Democratic majority in their delegation, and 1 state (Idaho) has an even split between both parties. Some states (7 states) only have 1 representative, those states are the following:

States with only 1 House member

Alaska (Republican)
Montana (Republican)
Wyoming (Republican)
North Dakota (Democrat)
South Dakota (Democrat)
Delaware (Republican)
Vermont (Democrat)

Analysis

This map is slightly deceiving because of the 7 states that only have 1 House member each. Although even those 7 states are interesting in that North and South Dakota are both represented by a Democrat, which is notable because neither of these states have been competitive in Presidential elections (with the exception of 2008). It is also notable that Delaware is represented by a Republican, when the surrounding area is primarily represented by Democrats. Of the states that have more than 1 house member, there are not very many surprises in the map, however there are some. One of those surprises is Mississippi, which is the only state in the deep south (besides Arkansas, which has a long history of a strong Democratic party) that has a majority Democratic delegation. While MS only has 4 representatives, the fact that 3 of them are Democrats is quite an achievement. It may be striking for some that Arkansas and Tennessee are colored blue, but it is important to point out that most of the Democrats in the south are moderate Democrats, which is why they are able to represent such conservative areas.

Friday, July 24, 2009

Current Governorships Map


The following map is of the current Governors of the 50 States. States colored blue have Democratic governors. States colored red have Republican governors. This map is current as of November 20, 2009.


Analysis

The most notable thing about this map is that no region is completely dominated by either party. The south (depending on how you define the south) still has Democratic governors, in Tennessee, North Carolina and Arkansas. Even in the northeast, where there are few Republicans elected for federal office, there are still Republican governors, in Vermont, Connecticut, and Rhode Island. The significance of this map is that it proves that even if a political party has no chance of winning in Presidential races, or even congressional races, they may still be competitive in gubernatorial races.

Tuesday, July 21, 2009

Current U.S. Senate Map


The following map shows the party affiliation of all 100 Senators. This map is current as of July 20, 2009. States colored Blue have 2 Democratic Senators (or 2 Senators who caucus with the Democrats, in the case of Connecticut and Vermont). States colored Red have 2 Republican Senators. States colored Purple have 1 Democratic and 1 Republican Senator.

There are 59 Democratic Senators and 41 Republican Senators.
Analysis

While it has been widely noted that since Democrats had 60 seats in the Senate, and had a filibuster-proof majority. This changed after the Massachusetts special senate election in January 2010, where the Republican won. In theory, that is correct, however it is important to remember that not every member of either the Democratic party or the Republican party is always going to vote in unison with their party. For example, many of the Democratic Senators that make up that total of 60 are moderate Democrats, who represent more conservative states than other Democratic Senators. In my opinion, while it may seem as though Democrats should be able to accomplish whatever they want (due to their 59-seat majority), that is not the case. In fact, moderate Democrats (and moderate Republicans) actually hold the power in the U.S. Senate.

An interesting thing about the map is that most of the purple states are also battleground states in Presidential Elections.

Saturday, July 18, 2009

2008 Presidential Election Results Map


The following is a map of the United States. States colored blue were won by Barack Obama and states colored Red were won by John McCain.


Barack Obama won 28 states and DC (365 Electoral Votes), John McCain won 22 states (173 Electoral Votes). Note: Obama won one of Nebraska's 5 Electoral Votes because NE divides its electoral votes by congressional district, and Obama won the Omaha district.

On June 21, 2008, I had posted on this blog my analysis of how the states would vote in the general election (My Electoral College Outlook). As election day got closer, the map changed. What I find most interesting is that I had put Indiana and North Carolina in the Solid Republican category, on election day both of these states voted for Obama (narrowly).

Saturday, June 21, 2008

My Electoral College Outlook

Legend:
Solid Blue = Solid Democratic [13 States, 168 EV]
Light Blue = Lean Democratic [2 States, 22EV]
Solid Red = Solid Republican [23 States, 189EV]
Pink = Lean Republican [2 States, 38EV]
Yellow = Battleground States [11 States, 121EV]

Solid Democratic States (13 States, 168 Electoral Votes)
  1. California - 55
  2. New York - 31
  3. Illinois - 21
  4. Massachusetts - 12
  5. Washington - 11
  6. Maryland - 10
  7. Connecticut - 7
  8. Maine - 4
  9. Rhode Island - 4
  10. Hawaii - 4
  11. Vermont - 3
  12. Delaware - 3
  13. District of Columbia - 3

Lean Democratic States (2 States, 22 Electoral Votes)

  1. New Jersey - 15
  2. Oregon - 7

Solid Republican States (23 States, 189 Electoral Votes)

  1. Texas - 34
  2. North Carolina - 15
  3. Georgia - 15
  4. Indiana - 11
  5. Tennessee - 11
  6. Arizona - 10
  7. Alabama - 9
  8. Louisiana - 9
  9. Kentucky - 8
  10. South Carolina - 8
  11. Oklahoma - 7
  12. Mississippi - 6
  13. Arkansas - 6
  14. Kansas - 6
  15. Nebraska - 5
  16. Utah - 5
  17. West Virginia - 5
  18. Idaho - 4
  19. Montana - 3
  20. North Dakota - 3
  21. South Dakota - 3
  22. Wyoming - 3
  23. Alaska - 3

Lean Republican States (2 States, 38 Electoral Votes)

  1. Florida - 27
  2. Missouri - 11

Battleground States (11 States, 121 Electoral Votes)

  1. Pennsylvania - 21
  2. Ohio - 20
  3. Michigan - 17
  4. Virginia - 13
  5. Wisconsin - 10
  6. Minnesota - 10
  7. Colorado - 9
  8. Iowa - 7
  9. New Mexico - 5
  10. Nevada - 5
  11. New Hampshire - 4